OBSERVATION SPACE STATISTICS
Sea Surface Temperature
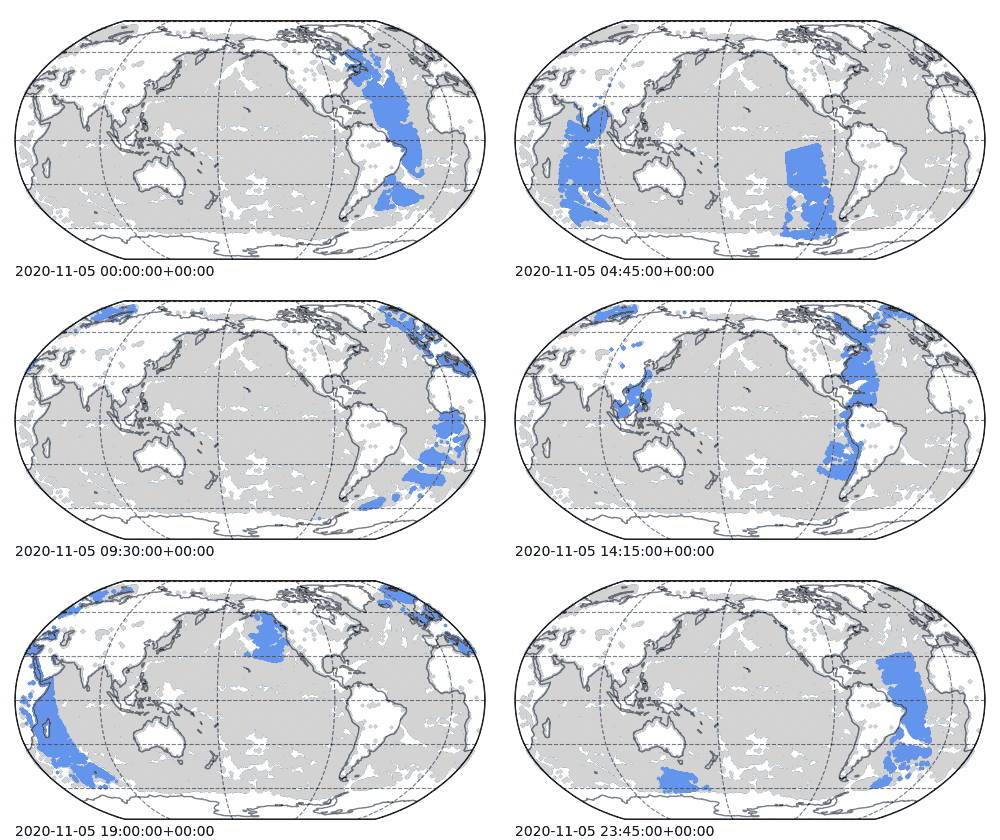
- Sea surface temperature retrievals from the Advanced Clear Sky Processor for Ocean (ACSPO)
- Sensors: AVHRR_FRAC
- Satellites: Metop-C
- (Currently only using a single AVHRR satellite, future plans will expand to all current AVHRR and VIIRS satellites)
Time Averaged Statistics
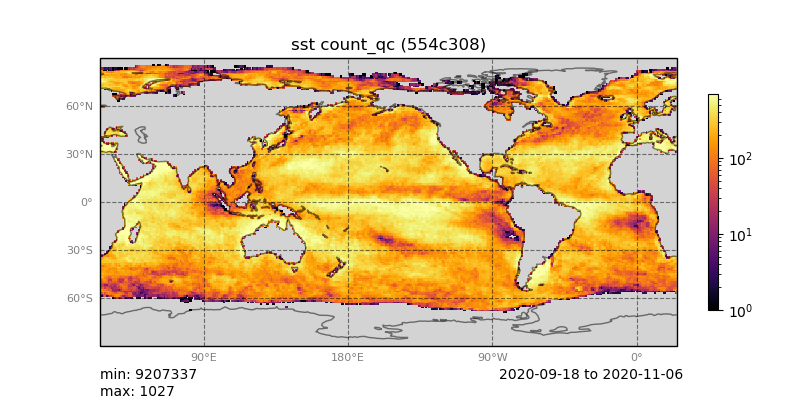
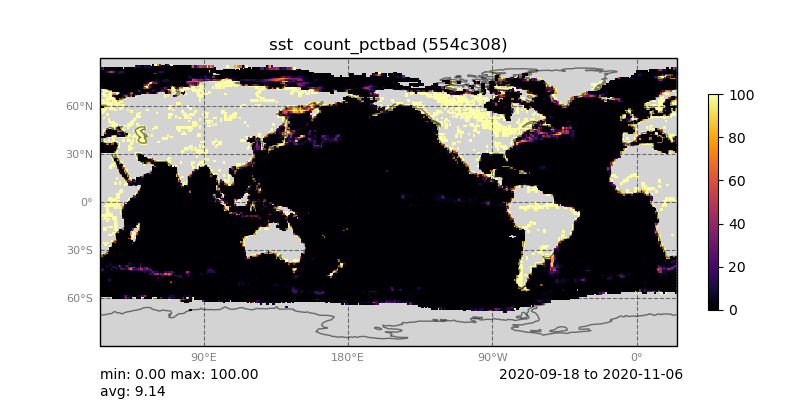
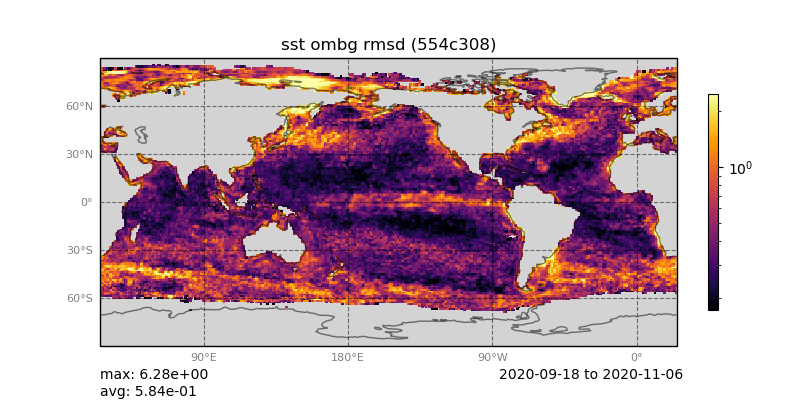
Time averaged statistics for up to the past 30 days. Stats are binned on a 1 degree grid.
Counts
Number of observations passing quality control (left) and the percentage of bad obs removed (right).
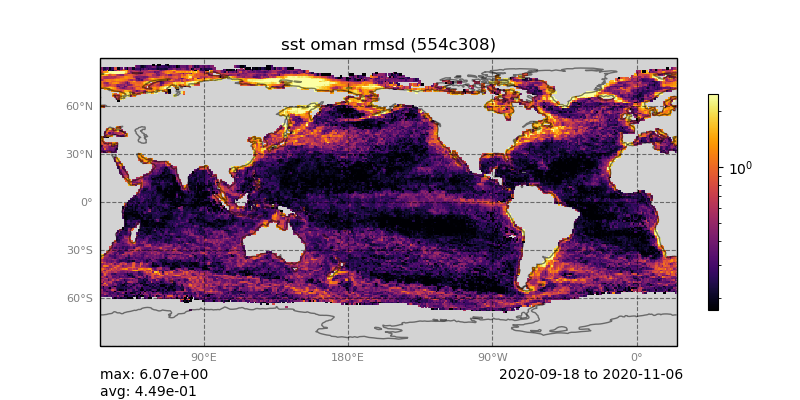
RMSD
Root mean squared deviation for O-B (left) and O-A (right).
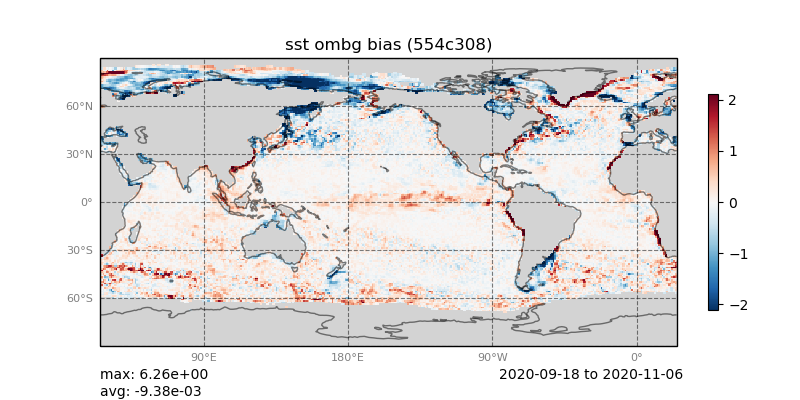
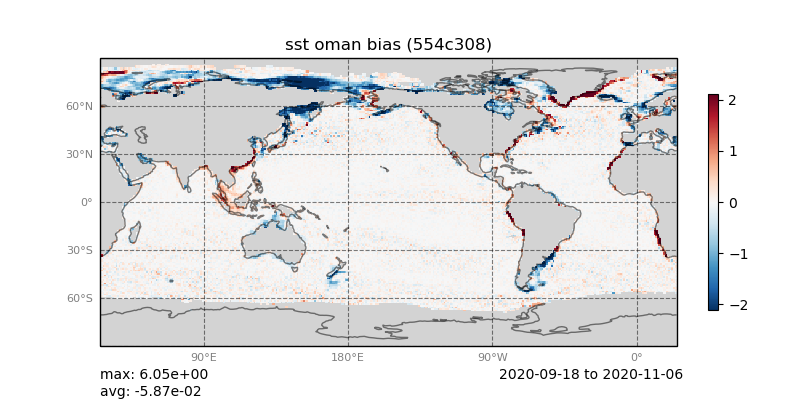
Bias
Bias for O-B (left) and O-A (right).
Time Averaged Statistics (diff with master)
Time averaged statistics for up to the past 30 days. Stats are binned on a 1 degree grid, and shown as the difference from the master branch.
RMSD
Root mean squared deviation for O-B (left) and O-A (right), for master - release/nightly


Bias
Bias for O-B (left) and O-A (right), for master - release/nightly


Timeseries Statistics
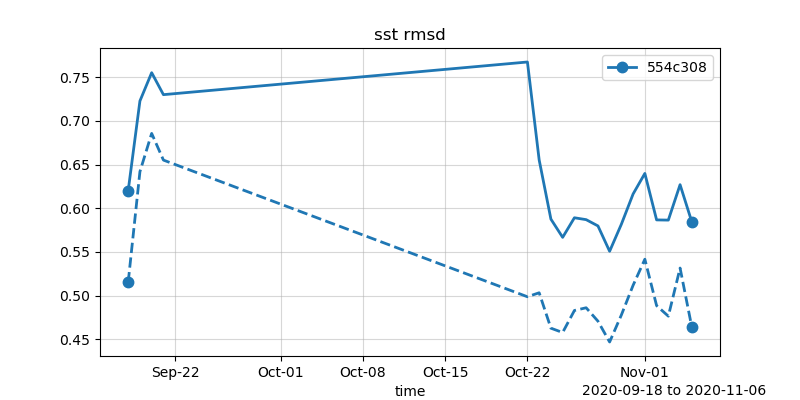
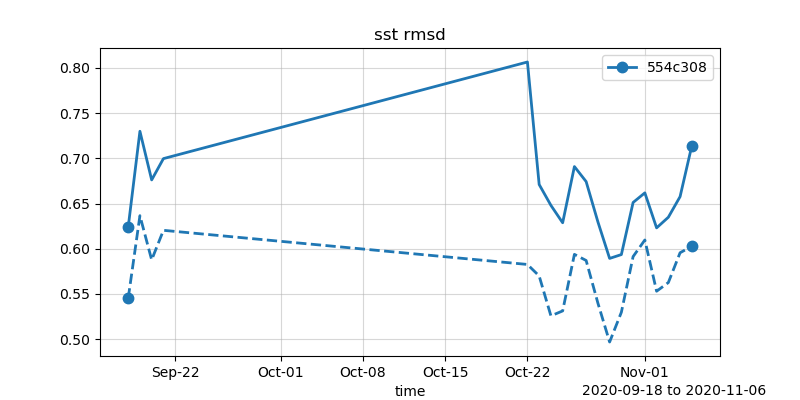
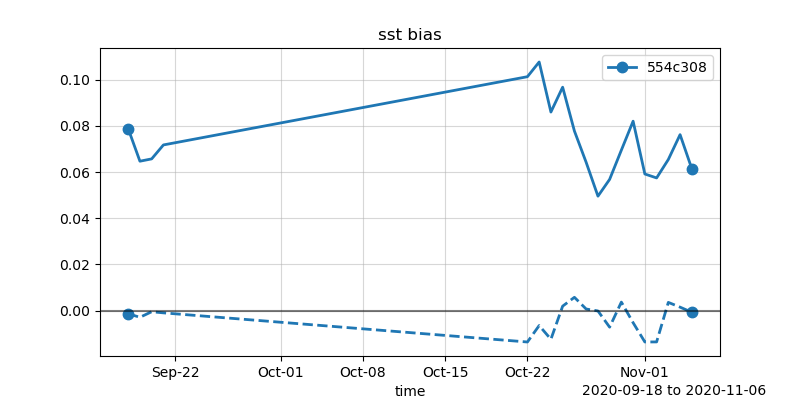
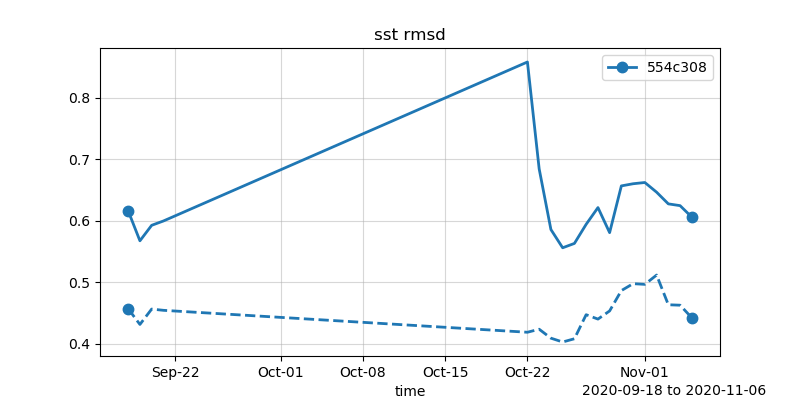
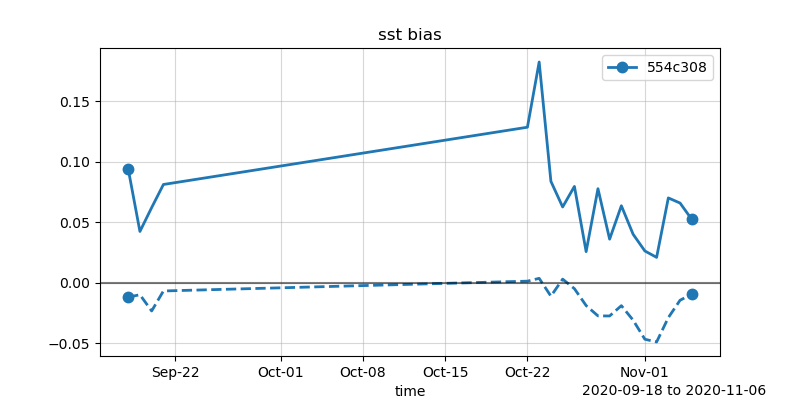
Timeseries of bias and RMSD for O-B (solid line) and O-A (dashed line).
If multiple colors are shown, they represent the realtime/retrospective runs from the given
git hash of the release/nightly or master branches of the repository.
Global
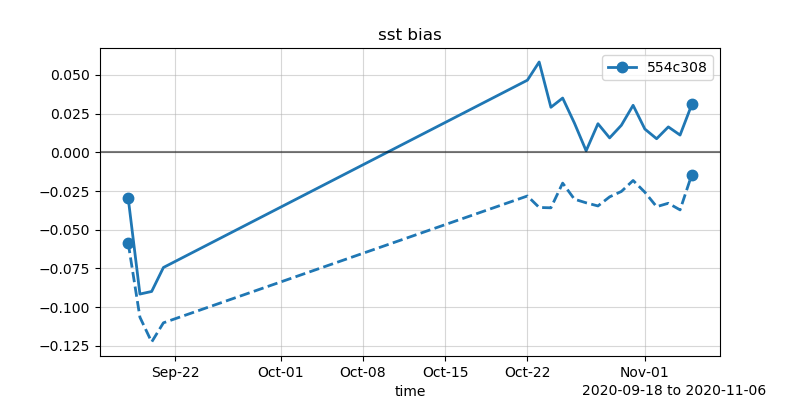
NH
Northen hemisphere midlatitudes (20N-60N).
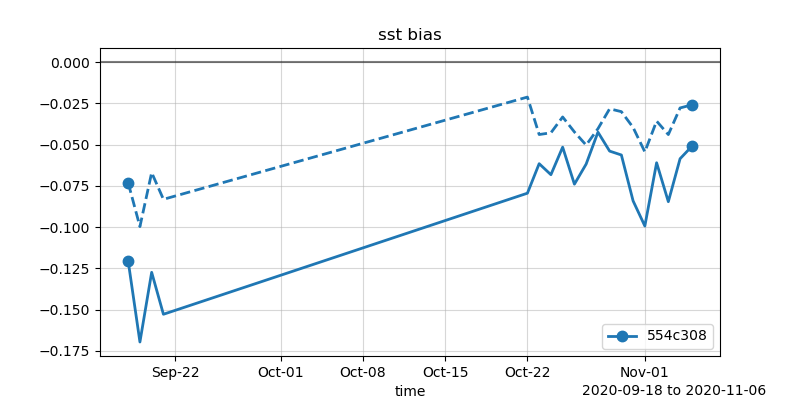
TP
Tropics (20S-20N).
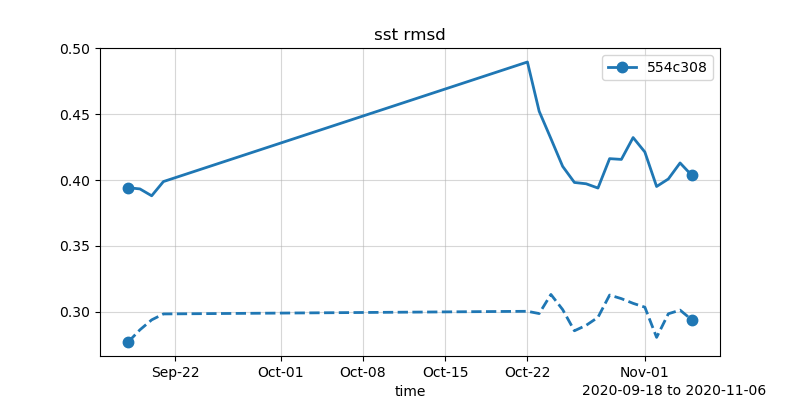
SH
Southern hemisphere midlatitudes (20S-60S).
Disclaimer: the data shown here is intended to serve as 1) a demonstration of marine DA efforts at JCSDA and 2) a continuous delivery pipeline to aid in software development of SOCA by JCSDA. This data is provided to the public with no guarantee of accuracy or timely delivery. For a reliable source of ocean monitoring data use operational products from other agencies such as NCEP